Volume & Order Flow: A Tradingview Guide
Feb 7, 2024
Tools
3 min
In this post, I will cover the following:
- Relative volume
- Market order bubbles
- Buy/Sell volume
- How I use them
- All my settings
Relative Volume:
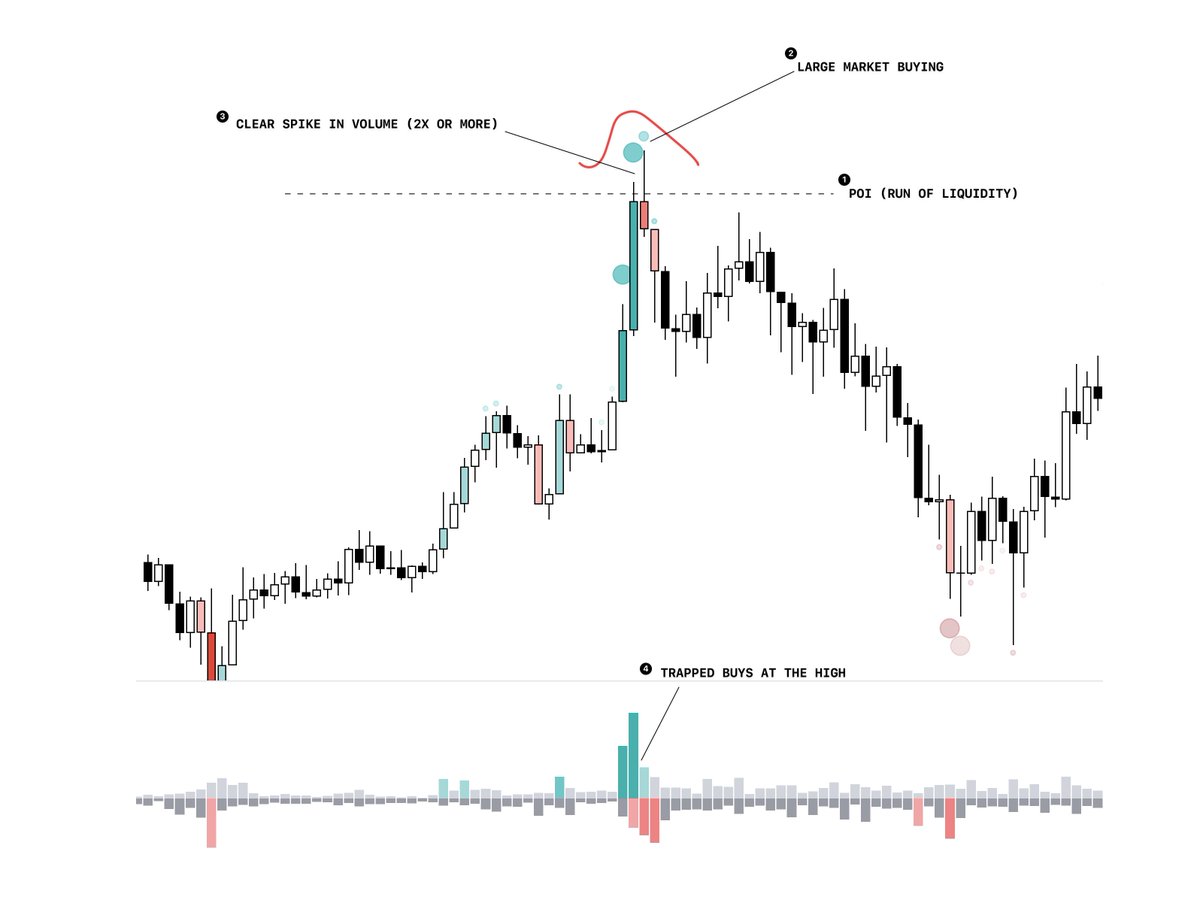
How is volume in comparison to previous candles average? I'm using a setting to look back at the previous 25 candles and comparing the volume against that average. If a candle has a volume that is 2x the average or above, it is classified as a volume spike.

Market Order Bubbles:
Identifying increased aggressiveness on either side of the market. At highs: shorts getting liquidated - market buy new longs entering - market buy At lows: longs getting liquidated (longs closing) - market sell new shorts entering - market sell

Market Order Bubbles 2:
These orders are set to chosen thresholds to filter out the larger sizes through bubbles. My settings: 1.5x 2.7x 4.3x

Buy/Sell Volume (extended delta):
Total buys and sells within a candle displayed in a column. I analyse the candles' OHLC and compare it to the buy or sell volume to identify extended delta. example: - candle closes green - more sell volume than buy volume = trapped sellers

Periodic Volume Profile:
looking for trapped value areas: Indicator which places a volume profile on top of any timeframe period or candle. I use this on a per bar basis to look for price closing outside of value area for reversals.

Execution example Its important to note, that all that I have mentioned in this thread will not be useful if you apply it to random points in the chart. You must have a plan and a poi as to where you will look to see this data.

Indicators used can be found within this stack section on the website.


